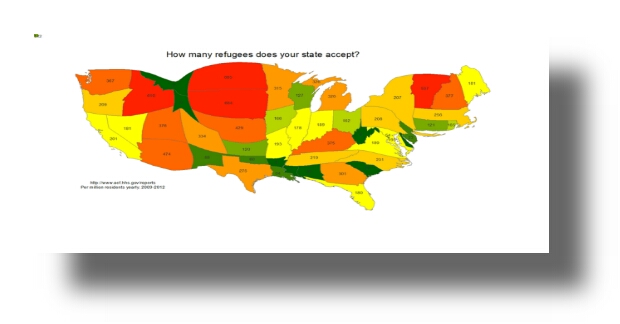
Look at this cool map I found for how many refugees were resettled in your state relative to your population: “This map by Casey Cupp is warped to show which states take on the highest number of refugees relative to their population. For example, the densely populated New Jersey takes in a far lower rate of refugees than that of the two Dakotas. What the map shows is that the distribution of refugees looks very different when considering state populations as opposed to strictly the number of people living in each state.”
Maphttp://www.humanosphere.org/basics/2014/02/map-day-refugees-accepted-us-states-population-adjusted/
Read original article here
https://refugeeresettlementwatch.wordpress.com/2015/05/14/36144-refugees-admitted-to-us-in-first-seven-months-of-fy2015/
